InterForm400 supports the following two types of charts:
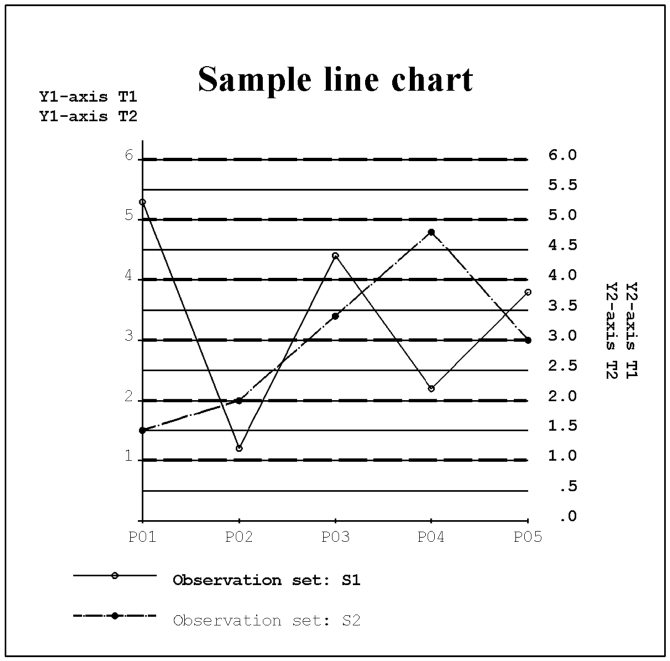
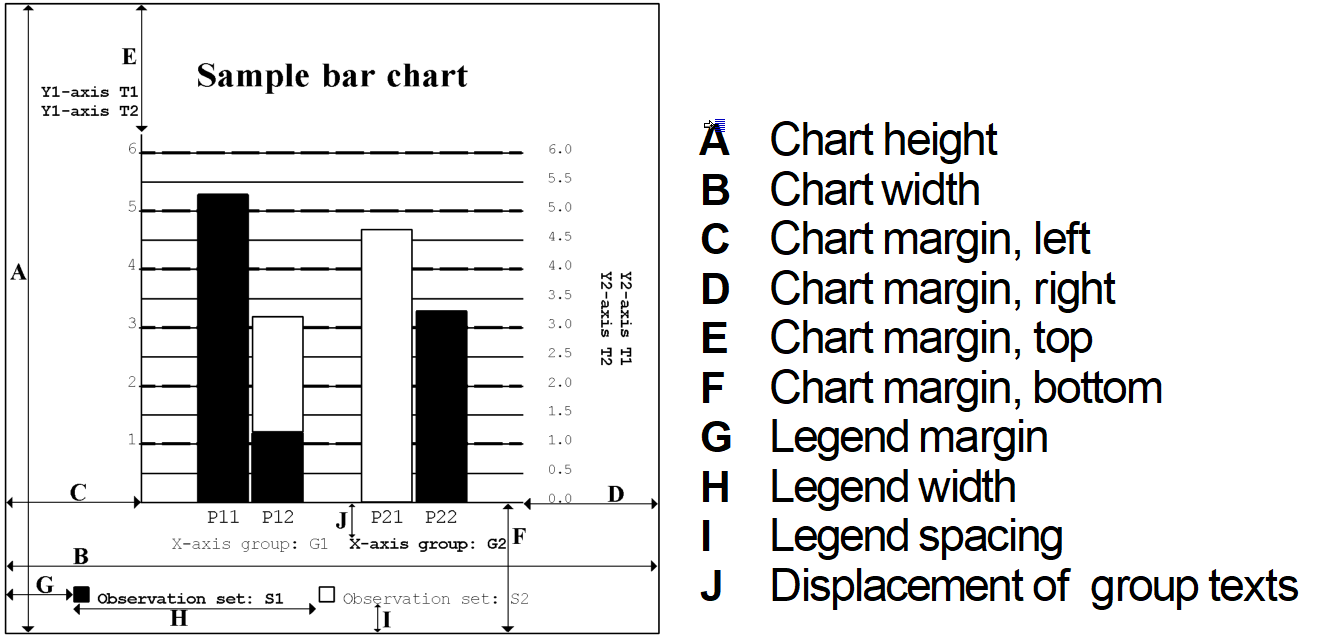
- Bar charts and
- Line charts
Samples are seen below:
You can define both types of charts by using the Work with Charts (WRKCHT) command.
By using the WRKCHT command you can define the complete layout of your charts including data to be presented in the charts.
To print a chart enter the &&CHT command inside your spooled file.
The &&CHT command also enables you to do the following while printing:
- Change the layout of your chart
- Change the data to be presented in the charts
- Create a chart without using the WRKCHT command.
Work with Charts command, WRKCHT
When using the Work with Charts command, APF3812/WRKCHT, the following display is shown:
Work with Chart definitions CHA100D
Position to . . . . . . _____________ Chart
Type options, press Enter. 2=Change 3=Copy 4=Delete 5=Display 6=Print chart
Opt Chart Description _ DEMOSALES Demo of Bar chart _ SAMPLEBAR Sample bar chart _ SAMPLELINE Sample line chart
End F3=Exit F5=Refresh F6=Create F11=View 2 F12=Cancel
|
Pressing F11 will result in an alternative display as seen below, where the size of the charts is displayed. Status is *PARTIAL if the setup of the chart is not complete.
Pressing F11 again will alternate between the two displays.
Work with Chart definitions CHA100D
Position to . . . . . . Chart
Type options, press Enter. 2=Change 3=Copy 4=Delete 5=Display 6=Print chart
Opt Chart Type Chart heig Chart widt Status _ DEMOSALES *BAR 4,000 4,000 _ SAMPLEBAR *BAR 4,000 4,000 _ SAMPLELINE *LINE 7,000 7,000 *PARTIAL
End F3=Exit F5=Refresh F6=Create F11=View 2 F12=Cancel
|
If a chart is complete, it is possible to printout the chart using option 6. Print chart. The chart will be printed out on the default output queue for the current job.
Press F6 to create a new chart:
Create Chart definition CHA110D
Chart . . . . . . . . . . __________ Type . . . . . . . . . . . __________ *BAR, *LINE
Description . . . . . . . ___________________________________
F3=Exit F12=Cancel
|
Chart
The name of the chart, which is been created.
Type
Write *BAR for a Bar chart and *LINE for a Line chart.
Description
Description of chart (not printed).
After entering the parameters above and pressing Enter, the ’Create Chart definition’ display is shown:
Create Chart definition CHA300D
Chart . . . . . . . . . : MYBAR Type . . . . . . . . . . : *BAR
Type options, press Enter. 1=Select
Opt Definition _ R Define general layout _ Define layout of the X-axis _ R Define X-axis points _ R Define layout of the Y1-axis _ Define layout of the Y2-axis _ R Define observations
F3=Exit F12=Cancel
|
Note: R indicates required information.
Enter ‘1' next to the definition you want to create or change.
When finished editing the chart, press F3 to exit and save the chart definition.
Define general layout
When selecting ’Define general layout’ the display below is shown. Here it is possible to set up parameters, that describe the general layout of the chart.
Define general layout CHA300D
Chart . . . . . . . . . : MYBAR Type . . . . . . . . . . : *BAR
Type choices, press Enter.
Chart header . . . . . . . _______________________________________ Chart header font . . . . ____ Chart header font color . ___ Chart height . . . . . . . ______ Inches.pels Chart width . . . . . . . ______ Inches.pels Chart margin, left . . . . ______ Inches.pels Chart margin, right . . . ______ Inches.pels Chart margin, top . . . . ______ Inches.pels Chart margin, bottom . . . ______ Inches.pels Frame line width . . . . . __ Dots Frame line color . . . . . ___ Legend margin . . . . . . ______ Inches.pels Legend width . . . . . . . ______ Inches.pels Legend spacing . . . . . . ___ Pels
F3=Exit F4=Prompt F12=Cancel
|
Chart header
The header of the chart.
Chart header font
Font used for the header text (prompt with F4).
Chart header font color
Color used for the header text (prompt with F4).
Chart height/width
Height and width of the frame in which the chart is printed.
Chart margins
The distances from the chart to the frame.
Frame line width/color
The line width (in dots) and color of the frame.
Legend margin
Distance from left edge of the frame to the text of the first observation set.
Legend width
Distance between text of the various observation sets.
Legend spacing
Distance from bottom edge of the frame to the text of the observation sets.
Define layout of the X-axis
When defining the layout of the X-axis, it is possible to define the layout of the axis it self, but also direction and displacement of the text belonging to the X-axis groups, if used.
Define layout of the X-axis CHA300D
Chart . . . . . . . . . : SAMPLELINE Type . . . . . . . . . . : *LINE
Type choices, press Enter.
X-axis line width . . . . __ Dots X-axis line color . . . . ___ X-axis text direction . . _ 1=Right, 2=Up, 3=Down Displacement, grp texts . ______ Inches.pels Bar width in % . . . . . . _20 1-100
F3=Exit F4=Prompt F12=Cancel
|
X-axis line width/color
Specifying the width and color of the X-axis of the chart.
X-axis text direction
The direction and rotation of the text for the X-axis: Right means horizontal text. Up or down means vertical text (going up or down).
Displacement, grp. texts
Distance from bottom edge of the chart to the text of the X-axis groups.
Bar width in %
Width of bars. The is measured in percentage of the maximum width.
Define X-axis points and X-axis groups
When selecting Define X-axis points you get the screen below, which overviews the existing X-axis groups:
Work with X-axis groups CHX100D
Chart . . . . . . . . . : MYBAR Type . . . . . . . . . . : *BAR
Position to . . . . . Seq number
Type options, press Enter. 2=Change 3=Copy 4=Delete 5=Display 7=Assign new seq nbr to x-axis grp 12=Work with X-axis points
Opt Seq number ID Text __ 10 MON Month
End F3=Exit F5=Refresh F6=Create F12=Cancel
|
It is possible to change, copy and display the X-axis groups, it is also possible to change sequence numbers and to work with X-axis points for the specific group.
Pressing F6 for creating a new X-axis group will display this:
Create X-axis group CHX110D
Chart . . . . . . . . . : MYBAR Type . . . . . . . . . . : *BAR
Seq number . . . . . . . . ___ X-axis group ID . . . . . ___ Text . . . . . . . . . . . _______________________________________________ Text font . . . . . . . . ____ Text font color . . . . . ___
F3=Exit F4=Prompt F12=Cancel
|
Seq number:
Specify a sequence number. This will decide the order of the groups.
X-axis group ID:
ID of the specific X-axis group.
Text:
Text used to specify group on print out. (Printed below chart).
Text font/color:
Font and color of the text above.
The position of the text is based upon the legend fields on the ’General Layout’ display and the layout of the x-axis.
Using option 12 it is possible to change sequence numbers and to work with X-axis points for the specific group as seen below.
Work with X-axis points
You can assign X-axis points to an existing X-axis group, by using option 12=Work with X-axis points in front of the group as described above.
In the example above, where we have created a group called Month, we might add 12 X-axis points for that group, marking the 12 months of the year.
Work with X-axis points CHX200D
Chart . . . . . . . . . : SAMPLELINE Type . . . . . . . . . . : *LINE X-axis group ID . . . . : G1
Type options, press Enter. 2=Change 3=Copy 4=Delete 5=Display 7=Assign new seq nbr to X-axis point
Opt Seq number ID Text Spc
(No X-axis points to display)
End F3=Exit F5=Refresh F6=Create F12=Cancel
|
If you press F6=Create to create a new X-axis point the following is displayed:
Create X-axis group CHX110D
Chart . . . . . . . . . : MYBAR Type . . . . . . . . . . : *BAR
Seq number . . . . . . . . __1
X-axis group ID . . . . . __A Text . . . . . . . . . . . Jan.____________________________________________ Text font . . . . . . . . __11 Text font color . . . . . __1 Relative spacing . . . . . _60
F3=Exit F4=Prompt F12=Cancel
|
Seq number:
Sequence number which decides the order of the axis points.
X-axis point ID:
ID of the X-axis point for this specific X-axis group. This ID must be unique i.e. no other X-axis point can have the same ID – not even in other X-axis groups.
Text:
Text below the chart to mark this point.
Text font/color:
Font and color of the text.
Relative spacing:
Specifies the spacing in pels between the bars (only used for bar charts).
Define layout of the Y1 (and Y2)-axis
InterForm400® offers the possibility to define two Y-axis’. This can be used for printing graphs on the same chart with two different units of measure.
Choose this option from the chart definition display, and the following is displayed:
Define layout of the Y1-axis CHA300D
Chart . . . . . . . . . : MYBAR Type . . . . . . . . . . : *BAR
Type choices, press Enter. Text 1 . . . . . . . . . . Number of installations________________________ Text 2 . . . . . . . . . . _______________________________________________ Text font . . . . . . . . __11 Text font color . . . . . __1 Text direction . . . . . . 1 1=Right, 2=Up, 3=Down Line width . . . . . . . . _2 Dots Line color . . . . . . . . __1 Minimum . . . . . . . . . _________0.00000 Increment . . . . . . . . _________1.00000 Maximum . . . . . . . . . ________10.00000 Edit word . . . . . . . . '__________________' Values font . . . . . . . __11 Values font color . . . . __1 Grid line type . . . . . . 9 1-9 Grid line width . . . . . _2 Dots Grid line color . . . . . __1 F3=Exit F4=Prompt F12=Cancel
|
Text1:
First line of text for the Y1-axis.
Text2:
Second line of text for the Y1-axis.
Text font/color:
Font and color for the text fields above.
Text direction:
Specifying the direction and rotation of the text for the
Y1-axis text:
Right means horizontal text. Up or down means vertical text (going up or down).
Line width:
Width of the Y1-axis in dots.
Minimum:
Specifies the smallest value for the Y1-axis.
Increment:
Specifies the difference between the Y1-grid lines (measured in Y1-units).
Maximum:
Specifies the maximum value for the Y1-axis.
Edit word:
Defines placement of commas, punctuation and minus sign. The value is written like ’ , .-’ (apostrophes must be included).
Values font/color:
Defines the font and color used for writing the values on the Y1-axis.
Grid line type:
The type or pattern of the grid line. The type number corresponds to the pattern as follows:
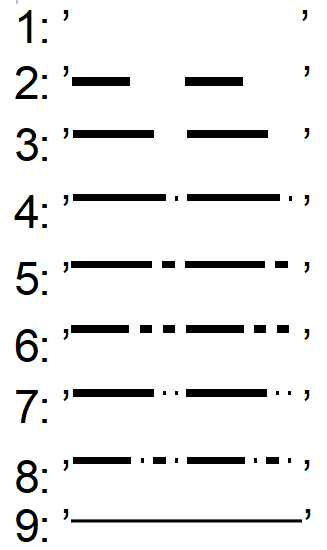
Grid line width/color:
Defines the width and color of the grid line.
Define observation set
When selecting Define observations from the Create chart definition menu, the following will be displayed:
Work with Observation sets CHS100D
Chart . . . . . . . . . : MYBAR Type . . . . . . . . . . : *BAR
Type options, press Enter. 2=Change 3=Copy 4=Delete 5=Display 7=Assign new seq nbr to observation set 12=Work with sample observations
Opt Seq number Obs set Text
(No Observation sets to display)
End F3=Exit F5=Refresh F6=Create F12=Cancel
|
Here it is possible to work with existing observation sets. It is also possible to create a new observation set using F6=Create, which will result in the display below.
For charts with type *BAR the entry screen looks as follows:
Create Observation set CHS110D
Chart . . . . . . . . . : MYBAR Type . . . . . . . . . . : *BAR
Seq number . . . . . . . . ___
Observation set . . . . . ___ Text . . . . . . . . . . . ______________________________________ Text font . . . . . . . . ____ Text font color . . . . . ___ Use Y1/Y2-axis . . . . . . _ 1=Y1, 2=Y2 Line type . . . . . . . . _ 1-9 Line width . . . . . . . . __ Dots
Color . . . . . . . . . . ___ Pattern . . . . . . . . . _ 0-8 Pattern color . . . . . . ___ F3=Exit F4=Prompt F12=Cancel
|
For charts with type *LINE the screen looks like this:
Change Observation set CHS110D
Chart . . . . . . . . . : SAMPLELINE Type . . . . . . . . . . : *LINE
Seq number . . . . . . . : ___
Observation set . . . . . ___ Text . . . . . . . . . . . _______________________________________ Text font . . . . . . . . ____ Text font color . . . . . ___ Use Y1/Y2-axis . . . . . . _ 1=Y1, 2=Y2 Line type . . . . . . . . _ 1-9 Line width . . . . . . . . __ Dots Point marker . . . . . . . _ C, C1-C8 Color . . . . . . . . . . ___
F3=Exit F4=Prompt F12=Cancel
|
Seq number:
The sequence number of this observation set. The sequence number is used for in which sequence this observation set is shown in relation to other observation sets.
Observation set:
Name of this observation set.
Text:
Description of the observation set. Printed below the chart.
Text font/color:
Font and color used for the text above.
Use Y1/Y2-axis:
Links the observation set to either the Y1- or Y2-axis.
Line type:
For charts with the type *LINE this decides the type of line representing this observation set. The various types can be seen above under ’Define layout of the Y1(and Y2)-axis’. The types used for grid lines are the same as these types.
Line width:
Define the width of the line representing this observation set.
Color
Color used for the line representing this observation set.
Pattern: Define the pattern inside the bars representing this observation set.
Pattern |
Description |
0 |
100% white |
1 |
2% shading |
2 |
10% shading |
3 |
20% shading |
4 |
35% shading |
5 |
55% shading |
6 |
80% shading |
7 |
99% shading |
8 |
100% shading |
Pattern color:
Color filling for the bars.
Point marker:
For charts with type *LINE this decides the form of the points representing this observation set.
Marker |
Description |
Blank |
No Point |
C |
Point 0 % filled |
C1 |
Point 2 % filled |
C2 |
Point 10 % filled |
C3 |
Point 20% filled |
C4 |
Point 35 % filled |
C5 |
Point 55 % filled |
C6 |
Point 80 % filled |
C7 |
Point 99 % filled |
C8 |
Point 100 % filled |
When you press Enter, you will return to Work with Observation sets. Now it is possible to appoint values to this observation set. Select option 12=Work with sample observations, and this will be displayed:
Work with Sample observations CHS200D
Chart . . . . . . . . . : SAMPLELINE Type . . . . . . . . . . : *LINE Observation set . . . . : S1 Demo
Enter values, press Enter.
ID Value Text Dec P01 ________________ Jan. P02 ________________ Feb. P03 ________________ Mar. P04 ________________ Apr. P05 ________________ May P06 ________________ Jun. P07 ________________ Jul. P08 ________________ Aug. P09 ________________ Sep. P10 ________________ Okt. P11 ________________ Nov. P12 ________________ Dec.
End F3=Exit F5=Refresh F12=Cancel
|
Prior to this an X-axis group has been created. In this case the group includes the ID’s P01-P12 with the text, ’Jan.’- ’Dec.’. The Work with sample observations has value fields for all X-axis points no matter what -axis group they belong to.
Now we have been through all states of creating a chart. If you have done this, you can now view and print out the chart in the following ways:
•If you have Swiftview installed, you are able to view the chart by pressing F5 (Display chart), from the chart definition display.
•You can print out the chart using option 6 from the Work with Chart definitions.
•You can print out the chart when merging with a spool file, if the spool file has either the &&CHA01 PRCH or &&CHA01 PRCM command inside. See descriptions of the &&CHA commands below.
The &&CHA Chart commands
General format of the &&CHA commands
From |
To |
Description |
|---|---|---|
1 |
5 |
&&CHA |
6 |
7 |
Format version |
9 |
18 |
Chart name |
20 |
23 |
Function ID |
25 |
Dep. |
Function Daa |
General description of the &&CHA commands
Chart naming:
To create an internally defined chart the first command issued must be the CRIC command. Internally defined charts are completely defined using the &&CHA commands in a spool file.
An externally defined chart is defined using the WRKCHT command before printing. First time you issue a &&CHA command for an externally defined chart, all parts of the chart definition - except the sample data - are automatically loaded. (To load the sample data use the LOEC command).
Internally defined chart names must begin with an asterisk (*) character as appose to externally defined charts, which can not begin with the asterisk character.
To reload an externally defined chart use the LOEC command.
Command examples
To print the Samplebar chart two inches down and two inches from the left margin print:
&&CHA01 SAMPLEBAR PRSM 02000 02000 000
To print the Samplebar chart with the following data:
Observation set, S1: Observation set, S2:
G11 = 1.2 G11 = 3.1
G12 = 2.4 G22 = 1.5
G21 = 1.4
G22 = 2.2
Print:
&&CHA01 SAMPLEBAR OSDA S1 G11 1.20000 G12 2.40000 G21 1.40000 G22 2.20000
&&CHA01 SAMPLEBAR OSDA S2 G11 3.10000 G22 1.50000
&&CHA01 SAMPLEBAR PRCH
To print an internally defined bar chart:
&&CHA01 *INT1 CRIC ... (Create internal chart)
&&CHA01 *INT1 GNLO ... (General layout)
&&CHA02 *INT1 GNLO ... (General layout)
&&CHA01 *INT1 XALO ... (Define X-axis layout)
&&CHA01 *INT1 Y1LO ... (Define Y1-axis layout)
&&CHA01 *INT1 Y1LO ... (Define Y1-axis layout)
&&CHA01 *INT1 XGLO ... (Define X-axis group layout)
&&CHA01 *INT1 XPLO ... (Define X-axis point - 1. point)
&&CHA01 *INT1 XPLO ... (Define X-axis point - 2. point)
&&CHA01 *INT1 OSLO ... (Define observation set layout)
&&CHA01 *INT1 OSDA ... (Add data)
&&CHA01 *INT1 PRCH ... (Print chart)
Create/delete internal chart commands
From |
To |
Description |
|---|---|---|
1 |
5 |
&&CHA |
6 |
7 |
01 |
9 |
18 |
Chart name |
20 |
23 |
CRIC |
25 |
34 |
*BAR or *LINE |
Description:
Creates a new internal chart definition.
Delete internal chart (DLIC 01):
From |
To |
Description |
|---|---|---|
1 |
5 |
&&CHA |
6 |
7 |
01 |
9 |
18 |
Chart name |
20 |
23 |
DLIC |
Description:
Deletes an internal chart definition.
Load commands
Load external chart (LOEC 01):
From |
To |
Description |
|---|---|---|
1 |
5 |
&&CHA |
6 |
7 |
01 |
9 |
18 |
Chart name |
20 |
23 |
LOEC |
25 |
34 |
Load sample data for observation set ID / *NONE / *ALL |
Description:
Loads (or reloads) a chart definition.
General layout commands
Define general layout (GNLO 01):
From |
To |
Description |
|---|---|---|
1 |
5 |
&&CHA |
6 |
7 |
01 |
9 |
18 |
Chart name |
20 |
23 |
GNLO |
25 |
74 |
Chart header / *BLANK |
76 |
79 |
Chart header font |
81 |
83 |
Chart header font color |
85 |
89 |
Chart height INPEL |
91 |
95 |
Chart width INPEL |
97 |
101 |
Chart margin, left INPEL |
103 |
107 |
Chart margin, right INPEL |
109 |
113 |
Chart margin, top INPEL |
115 |
119 |
Chart margin, bottom INPEL |
121 |
122 |
Frame line width in points |
124 |
126 |
Frame line color |
Description:
Describes general layout of chart
Define general layout (GNLO 02):
From |
To |
Description |
|---|---|---|
1 |
5 |
&&CHA |
6 |
7 |
01 |
9 |
18 |
Chart name |
20 |
23 |
GNLO |
25 |
29 |
Legend margin INPEL |
31 |
35 |
Legend width INPEL |
37 |
39 |
Legend spacing in pels |
Desciption:
Describes general layout of chart.
X-axis commands
Define X-axis layout (XALO 01):
From |
To |
Description |
|---|---|---|
1 |
5 |
&&CHA |
6 |
7 |
01 |
9 |
18 |
Chart name |
20 |
23 |
XALO |
25 |
26 |
X-axis line width in points |
28 |
30 |
X-axis line color |
32 |
32 |
X-axis text direction |
34 |
38 |
Displacement, group texts |
40 |
42 |
Bar width in % *1 |
Note:
*1 For *BAR charts only.
Description:
Describes layout of the X-axis.
Y1-/Y2-axis commands
Define Y1-axis/Y2-axis layout (Y1LO 01/Y2LO 01):
From |
To |
Description |
|---|---|---|
1 |
5 |
&&CHA |
6 |
7 |
01 |
9 |
18 |
Chart name |
20 |
23 |
Y1LO/Y2LO |
25 |
74 |
Text 1 / *BLANK |
76 |
125 |
Text 2 / *BLANK |
Description:
Describes layout of the Y1- or Y2-axis.
Define Y1-axis/Y2-axis layout (Y1LO 02/Y2LO 02):
From |
To |
Description |
|---|---|---|
1 |
5 |
&&CHA |
6 |
7 |
01 |
9 |
18 |
Chart name |
20 |
23 |
Y1LO/Y2LO |
25 |
28 |
Text font |
34 |
34 |
Text direction |
36 |
37 |
Line width in points |
39 |
41 |
Line color |
43 |
50 |
Minimum (Integer part) |
51 |
51 |
Minimum (Decimal point) |
52 |
56 |
Minimum (Decimals) |
57 |
57 |
Sign minimum ( - indicates negative value) |
59 |
66 |
Increment (Integer part) |
67 |
67 |
Increment (Decimal point) |
68 |
72 |
Increment (Decimals) |
74 |
81 |
Maximum (Integer part) |
82 |
82 |
Maximum (Decimal point) |
83 |
87 |
Maximum (Decimals) |
88 |
88 |
Sign maximum ( - indicates negative value) |
90 |
109 |
Edit word (including ‘-s) |
111 |
114 |
Values font |
116 |
118 |
Values font color |
120 |
120 |
Grid line type |
122 |
123 |
Grid line width in points |
125 |
127 |
Grid line color |
Description:
Describes layout of the Y1- or Y2-axis.
X-axis group commands
Add/change X-axis group layout (XGLO 01):
From |
To |
Description |
|---|---|---|
1 |
5 |
&&CHA |
6 |
7 |
01 |
9 |
18 |
Chart name |
20 |
23 |
XGLO |
25 |
27 |
X-axis group ID |
29 |
31 |
Copy definition from X-axis group ID |
33 |
82 |
Text / *BLANK |
84 |
87 |
Text font |
89 |
91 |
Text font color |
Description:
Adds or changes the layout of a X-axis group.
Delete X-axis group (DLXG 01):
From |
To |
Description |
|---|---|---|
1 |
5 |
&&CHA |
6 |
7 |
01 |
9 |
18 |
Chart name |
20 |
23 |
DLXG |
25 |
27 |
X-axis group ID |
Description:
Deletes a X-axis group.
X-axis point commands
Add/change X-axis point layout (XPLO 01):
From |
To |
Description |
|---|---|---|
1 |
5 |
&&CHA |
6 |
7 |
01 |
9 |
18 |
Chart name |
20 |
23 |
XPLO |
25 |
27 |
X-axis group ID *1 |
29 |
31 |
X-axis point ID |
33 |
35 |
Copy definition from X-axis point ID |
37 |
86 |
Text / *BLANK |
88 |
91 |
Text font |
93 |
95 |
Text font color |
97 |
99 |
Relative spacing |
Note:
*1 Required for new X-axis points.
Description:
Adds or changes the layout of an X-axis point.
Delete X-axis point (DLXP 01):
From |
To |
Description |
|---|---|---|
1 |
5 |
&&CHA |
6 |
7 |
01 |
9 |
18 |
Chart name |
20 |
23 |
DLXP |
25 |
27 |
X-axis group ID |
Description:
Deletes an X-axis point.
Observation set commands
Add/change observation set layout (OSLO 01):
From |
To |
Description |
|---|---|---|
1 |
5 |
&&CHA |
6 |
7 |
01 |
9 |
18 |
Chart name |
20 |
23 |
OSLO |
25 |
27 |
Observation set ID |
29 |
31 |
Copy definition from observation set ID |
33 |
82 |
Text / *BLANK |
84 |
87 |
Text font |
89 |
91 |
Text font color |
93 |
93 |
Use Y1/Y2-axis |
95 |
95 |
Line type |
97 |
98 |
Line width in points |
100 |
101 |
Point marker *1 |
103 |
105 |
Color |
107 |
107 |
Pattern *2 |
109 |
111 |
Pattern color *2 |
Notes:
*1 *LINE charts only
*2 *BAR charts only
Description:
Adds or changes the layout of an observation set.
Delete observation set (DLOS 01):
From |
To |
Description |
|---|---|---|
1 |
5 |
&&CHA |
6 |
7 |
01 |
9 |
18 |
Chart name |
20 |
23 |
DLOS |
25 |
34 |
Observation set ID / *ALL |
Description:
Deletes an observation set.
Clear observation set data (CLOS 01):
From |
To |
Description |
|---|---|---|
1 |
5 |
&&CHA |
6 |
7 |
01 |
9 |
18 |
Chart name |
20 |
23 |
CLOS |
25 |
34 |
Observation set ID / *ALL |
Description:
Clears a single or all observation sets.
Data commands
Add/change data by ID (OSDA 01):
From |
To |
Description |
|---|---|---|
1 |
5 |
&&CHA |
6 |
7 |
01 |
9 |
18 |
Chart name |
20 |
23 |
OSDA |
25 |
27 |
Observation set ID |
29 |
31 |
Observation ID 1 |
33 |
40 |
Value 1 (Integer part) |
42 |
46 |
Value 1 (Decimals) |
47 |
47 |
Sign Value 1 ( - indicates negative value) |
49 |
51 |
Observation ID 2 |
53 |
60 |
Value 2 (Integer part) |
62 |
66 |
Value 2 (Decimals) |
67 |
67 |
Sign Value 2 ( - indicates negative value) |
69 |
71 |
Observation ID 3 |
73 |
80 |
Value 3 (Integer part) |
82 |
86 |
Value 3 (Decimals) |
87 |
87 |
Sign Value 3 ( - indicates negative value) |
89 |
91 |
Observation ID 4 |
93 |
100 |
Value 4 (Integer part) |
102 |
106 |
Value 4 (Decimals) |
107 |
107 |
Sign Value 4 ( - indicates negative value) |
109 |
111 |
Observation ID 5 |
113 |
120 |
Value 5 (Integer part) |
122 |
126 |
Value 5 (Decimals) |
127 |
127 |
Sign Value 5 ( - indicates negative value) |
Description:
Adds or changes data in an observation set by observation ID.
Print chart commands
Print sample chart (PRSM 01):
From |
To |
Description |
|---|---|---|
1 |
5 |
&&CHA |
6 |
7 |
01 |
9 |
18 |
Chart name |
20 |
23 |
PRSM |
25 |
25 |
Sign (+/-) distance top edge |
26 |
30 |
Distance to paper top edge INPEL |
32 |
32 |
Sign (+/-) distance left edge |
33 |
37 |
Distance to paper left edge INPEL |
39 |
41 |
Rotation |
Description:
Prints a sample chart.
Print chart (PRCH 01):
From |
To |
Description |
|---|---|---|
1 |
5 |
&&CHA |
6 |
7 |
01 |
9 |
18 |
Chart name |
20 |
23 |
PRCH |
25 |
25 |
Sign (+/-) distance top edge |
26 |
30 |
Distance to paper top edge INPEL |
32 |
32 |
Sign (+/-) distance left edge |
33 |
37 |
Distance to paper left edge INPEL |
39 |
41 |
Rotation |
Description:
Prints a chart.
TIP: The &&CHA commands in a spool file are interpreted when the spool file is merged with an overlay.