The contents of the Log Database looks like below:
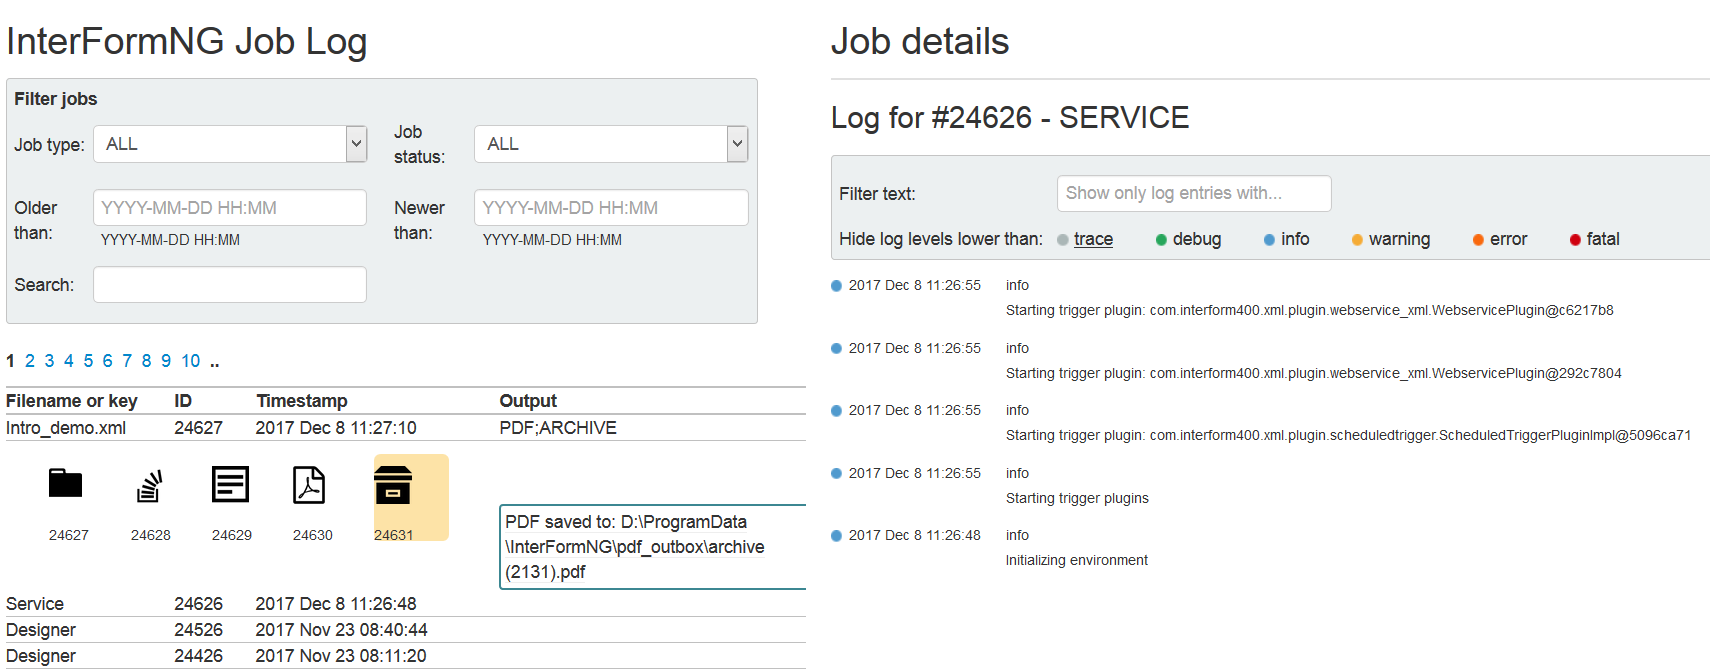
The left column: Job logs
In the bottom of the left side you see a list of all the processed input files. The files are listed in chronological order with the newest files at the top.
The status of the output relates to the color of the line:
If processing completed successfully the line is shown in black.
If warnings occurred, then the line is yellow.
If any error occurred, then the relevant line is shown in red.
The columns of the bottom left are:
Filename or key
The leftmost column labelled ‘Filename or key’ shows this information:
If you have set a value for the meta data key, interform.log.info during processing of the file, then the value is shown in this list.
If this meta data key was not set, then it will either indicate the type of function used or it will be the file name - if the input file entered InterFormNG via a monitored folder.
You can use the interform.log.info meta data key to make it possible to e.g. search the log for a specific invoice if you e.g. set the meta data key to Invoice_x, where x is the invoice number found in the input XML file.
ID
The internal job ID given to the job, that initiated the process.
Timestamp
The date and time when processing of the file initiated.
Output
The types of output, that was created - or was attempted to be created.
In the top left side you can subset (or filter) the list of the processed files. The search field is compared to the values displayed in the Filename or key column.
If you click a row you can see the details of the various outputs for the specific input file. In the screen shot above the first line was clicked (and mouse placed over the rightmost icon), thus we can see, that a PDF file was successfully created.
The right column: Job details
If we click any of the icons/jobs on the left, then the details of the job is shown on the right:
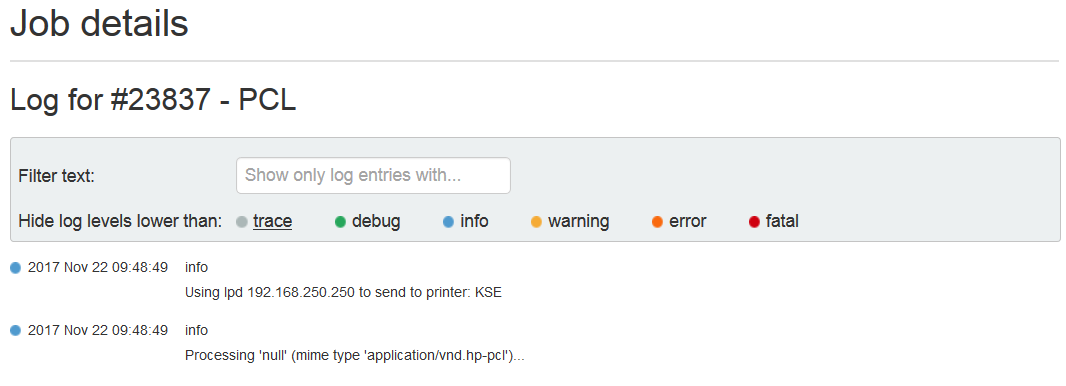
In the bottom of the page logs are listed. Each of the logs are indicated with the severity on the left with a color, that fits the list in the filter.
In case of an error a stack trace will be generated. If there is a stack trace, a lightning icon on the right will be included. If you click the icon the right the trace will be displayed.
If you want to see the details of a specific log you can click the relevant line.