InterFormNG2 includes a system monitor. This is a tool for the system administrator, that can be used in order to verify the health of InterFormNG2 and how busy the application currently is.
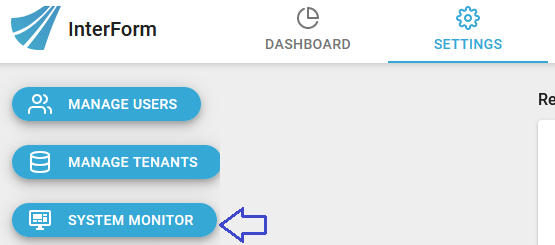
You can find the system monitor by signing on as a system administrator and looking into the settings for the system.
It is also possible to let InterFormNG2 report a critical health situation via email to a system administrator.
Here you find the System monitor option:

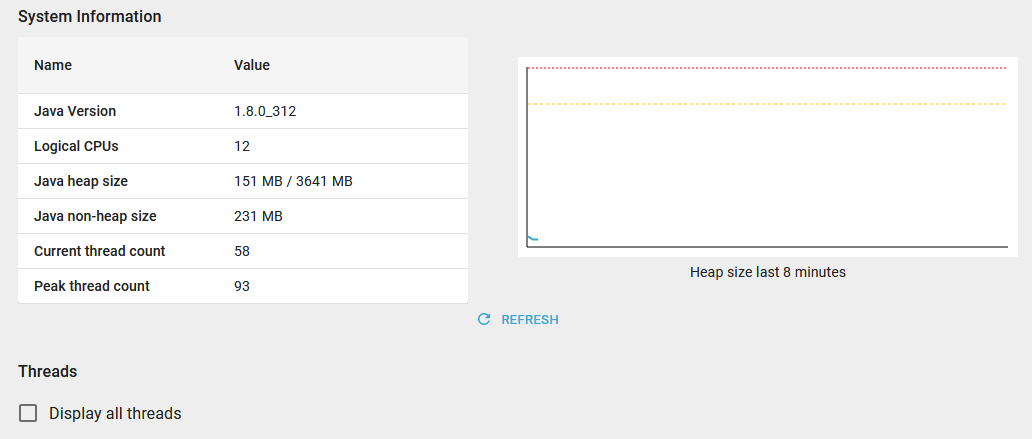
You will see this, if you select the icon above:

The elements are described below:
Java Version
The version of the Java runtime environment that runs InterFormNG2. This version number may be requested by support in connection with support cases.
Logical CPUs
The number of logical CPU cores. Physical cores with hyper-threading count as two logical cores.
Java heap size
This value displays the current heap usage, as well as the maximum heap size available to the Java virtual machine. For consistent performance it is recommended that current heap size should go below 80% of the maximum after a garbage collection. In other words, it is okay for the current heap to peak above 80%, but it should stay below 80% most of the time.
A health warning is issued when the current heap has been consistently above 80% for a period of 5 minutes.
To increase the maximum heap size, increase the value of the JVM option -Xmx. On a Windows installation, this can be set in the file NG2.exe.vmoptions in the installation folder. On IBMi it is set in the startup script service-as400.sh. On Linux it is set in the iformng2.service file.
Note that the total value of Xmx plus Java non-heap size must not exceed the amount of RAM on the host machine.
Java non-heap size
This is the base heap allocation used by Java runtime to hold the application code in memory.
Storage used
This value displays the current storage usage and available storage on the drive that holds the INTERFORMNG2_HOME folder.
A health warning is issued when the current storage usage is above 80% of the available storage.
To reduce storage space usage, consider reducing the system log file retention time. When using the embedded database (the default configuration), storage space usage can also be reduced by lowering the job log retention time and printer queue retention time in the tenant settings, as well as compressing the log database.
Number of tenants / Max tenants allowed
This is the total number of tenants that have been created and the maximum number of tenants allowed by the license. Without a multi-tenant license, the maximum number of tenants will be one.
Database connections
This value is the number of connections between InterFormNG2 and its relational database.
The count does not include connections to databases configured in tenant settings for use with workflow components, nor database connections defined in XENT files.
When InterFormNG2 is configured to use an external database, this number should be well below the maximum number of connections allowed by the database. If it is close to the maximum, consider changing the database configuration.
When using a managed database in a cloud environment such as Azure or AWS, the database tier usually puts a limit on the maximum number of allowed connections.
As an alternative to changing the database configuration, use the InterForm connection pool and adjust the ng2.maxPoolSize property to a lower number and/or change the ng2.maxIdleTime to a lower number. The idle time is the number of seconds a connection remains allocated while not used. Note that reducing these values may have a negative performance impact.
Pending database tasks
This value is the number of database requests that are queued and waiting for an available connection. Connections are allocated in pools, so if too many database requests are active concurrently, the connection pool may not have enough connections available.
The number of pending database tasks should preferably be low (close to 0). Having pending tasks will degrade performance. If this value is consistently high, it indicates that the connection pool is too small. A health warning is issued if the number of pending tasks frequently exceed the number of database connections.
When using the InterForm connection pool, the maximum allowed number of connections in each pool can be increased by changing the value of the property ng2.maxPoolSize.
Failed Workflows
These two numbers indicate the number of workflows that failed to start and the number of workflows that have started successfully. Note that a workflow is also counted as started when it is in suspended state.
If some workflows have failed to start, it is typically due to errors in the workflow definition.
To find the exact names of the failed workflows, search the system log for the text "Error starting workflow". A workflow failure notification is also issued on tenant level.
Current thread count / Peak thread count
This is the number of currently allocated threads, and the number of threads when it peaked (since last restart). To see the state and names of each thread, toggle “display all threads”. If the system is experiencing unusually high CPU usage, it can be interesting to see which threads are in state “RUNNABLE”, as these are the ones that are currently executing and using CPU time.
Status
This indicates if InterFormNG2 is in online of offline state. Online means that it can access the Internet on port 443, while offline indicates that it has no Internet connection on port 443. When the system is offline, some support, tutorial and notification functionality is unavailable.
Note that the heap size value will refresh automatically, but all other values are only updated after pressing the refresh button.
You can click the option, Display all threads in the bottom if you want to see a list of all InterFormNG2 threads.